


Black Monday Turns into Green Monday

Usually when you see stocks hit hard on a Friday and end on the low it’s a sign that Monday’s open isn’t going to be great. Despite making a new low early in the session and likely taking out many stops with it, the S&P 500 rebounded to end the day in the green on high volume.
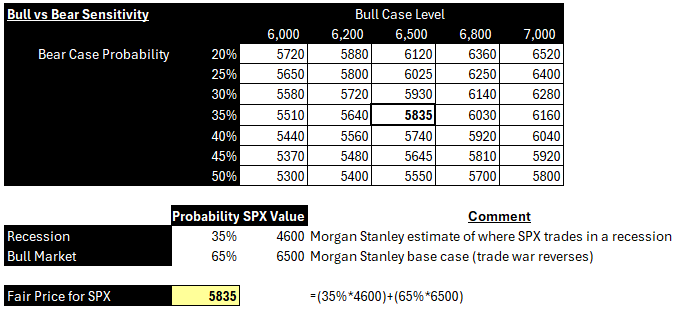
I shared the following sensitivity table today which sensitizes end of year bull case levels for the S&P 500 (SPX) and the probabilities of a recession to determine a fair price to pay for SPX. Goldman Sachs over the weekend said there is a 35% chance of a recession this year while other institutions range from 20-45%. Taking Goldman’s 35% and Morgan Stanley’s base case as the bullish end of year target, a fair for SPX is 5,835. Anything below this level is hypothetically “cheap” and anything about it “expensive”. Of course, assumptions can change going higher or lower, but that’s the fun part where Mr. Market keeps you on your toes.
Key Index Levels
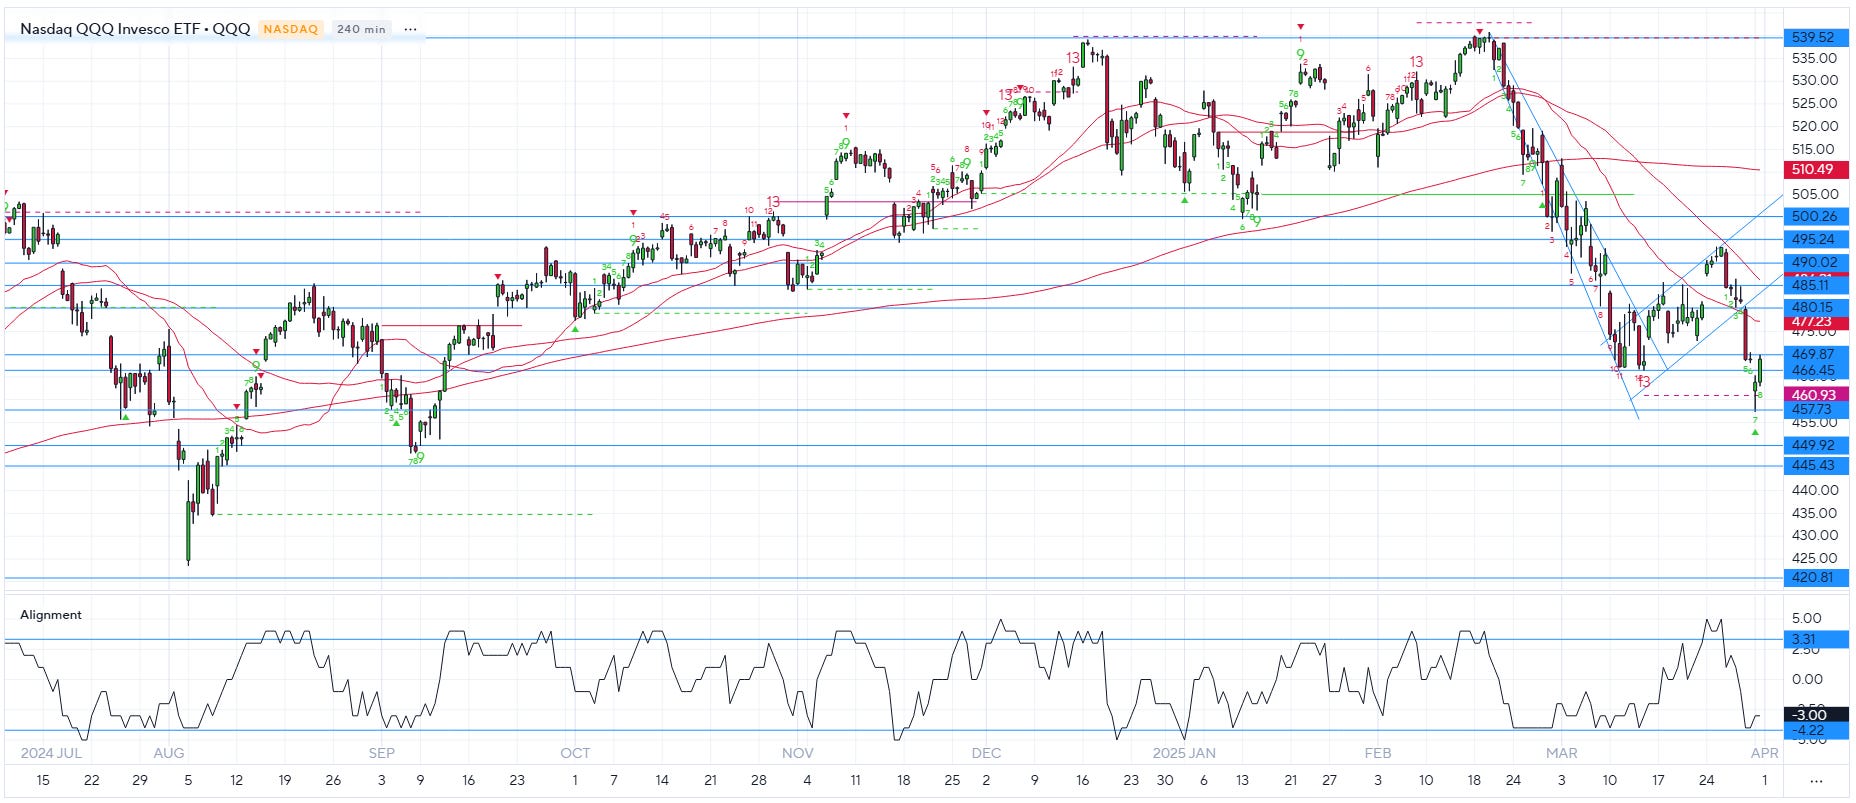
The SPY 0.00%↑ and QQQ 0.00%↑ DeMark charts below have support and resistance marked up based on prior levels and gamma through April OPEX. Every index lost bear flag support last Friday.
QQQ is generally bearish below $475 and bullish above $480. 4-hour DeMark price chart and option open interest through April OPEX below.

Where could SPY 0.00%↑ go next? If we lose $550 for two consecutive closes, we will likely see $525-530, which is where Trump’s trade war bottomed previously using positioning as a guide. $525 is also peak negative gamma. Losing $550 is a potential sign that growth could be deteriorating faster than expected, and recession risk could be increasing. In a recession SPY is likely to reach $460. Over time, continued stability in the economic data, especially in the jobs market (weekly claims, monthly payrolls), may provide reassurance that recession risks are overstated. From a policy standpoint, the best-case scenario is Trump reverses many of the tariff plans within the next few weeks, which would result in a sharp rally towards $600 at a minimum.
SPY is generally bearish below $560 and bullish above $570. 4-hour DeMark price chart and option open interest through April OPEX below.
Keep reading with a 7-day free trial
Subscribe to The Data-Driven Investor to keep reading this post and get 7 days of free access to the full post archives.