


Decoding Friday's Option Flows: Key Signals Unveiled

Index Models (Based on Option Flows)
Note: Red zone is bearish where investors should sell positions, green zone is bullish where investors should accumulate positions (neutral = coin toss). Signals in the index models drive the bias for single stock positions (i.e., if index models are bearish, going long a single stock within the index isn’t smart regardless of the underlying signal).
S&P 500 SPY 0.00%↑ 5 Trading Day (TD) Risk Model
Last Signal: Slightly Bearish
Current Signal: Neutral

S&P 500 SPY 0.00%↑ 15 TD Risk Model
Last Signal: Neutral
Current Signal: Slightly Bearish
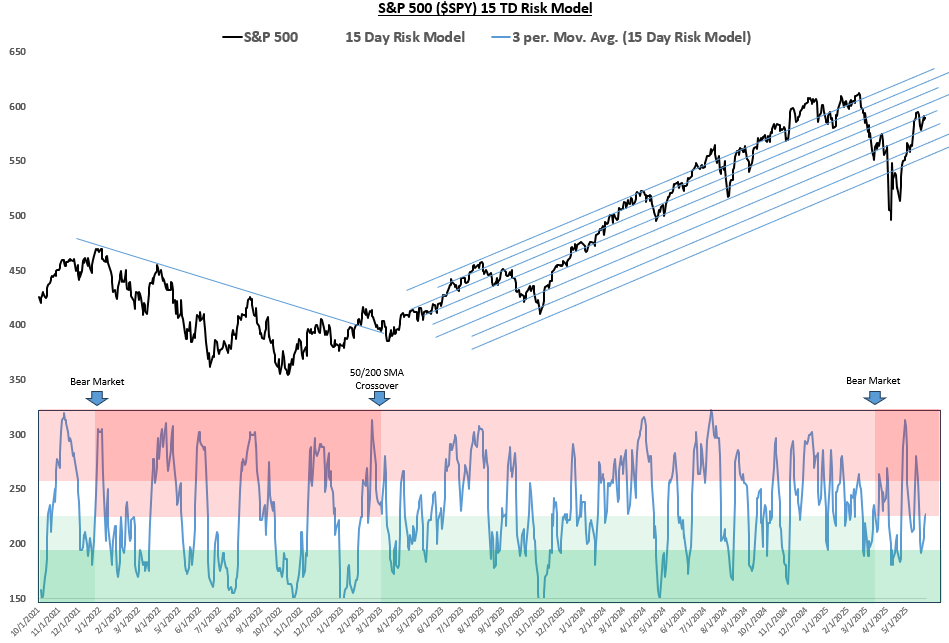
Note: Signal line in the 15 TD chart above is the 3-day moving average (DMA) of 15 Day Risk column. 5 TD chart above is the 5 Day Risk EMA column. Everything else in the table is a “nice to know” metric (details in Appendix). For details on the 15 Day Risk signal models check out this post.

QQQ 0.00%↑ 15 TD Risk Model
Last Signal: Bullish
Current Signal: Neutral

Bonus Chart: Weekly CFTC Nasdaq Positioning Model
This chart is based on positioning and price from 5/27. The CFTC releases this data on Fridays, I model it, then you get the chart below once a week. Generally, it’s bullish when shorts are high and less investors are long. Pretty simple. Current signal is slightly bearish to neutral, which makes sense given asset managers have chased this rally.

Russell 2000 IWM 0.00%↑15 TD Risk Model
Last Signal: Bullish
Current Signal: Neutral

Single Stock Models (Based on Option Flows)
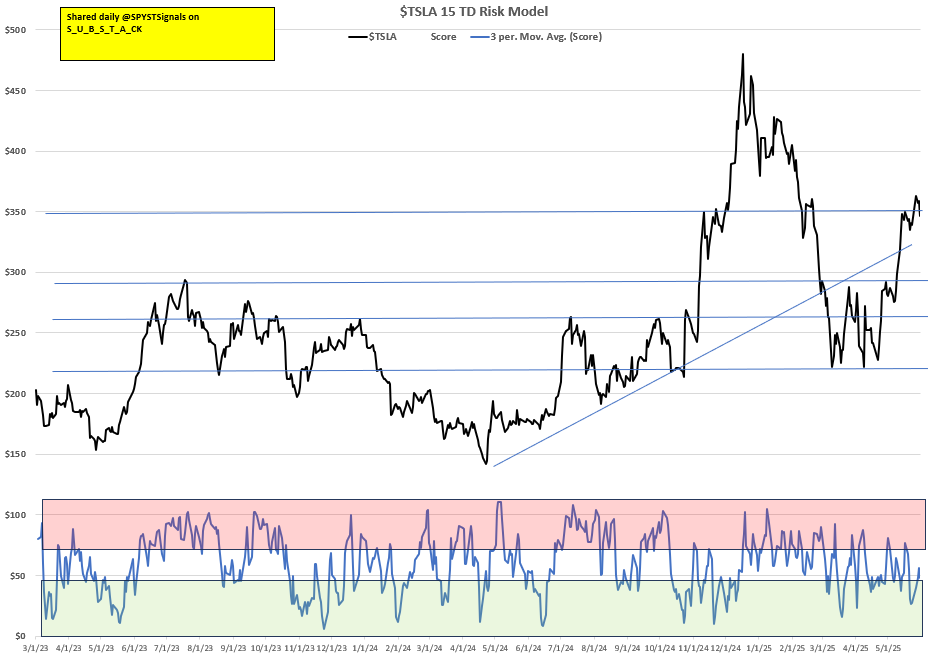
TSLA 0.00%↑ 15 TD Risk Model
Last Signal: Bullish
Current Signal: Neutral
NVDA 0.00%↑ 15 TD Risk Model
Got the expected post-earnings pop in the shares. NVDA broke above resistance, then fell back below it after failing at $140 resistance. There was a ton of open interest at those higher levels and it’s likely those call option holders sold driving price lower.
Last Signal: Neutral
Current Signal: Slightly bullish

Keep reading with a 7-day free trial
Subscribe to The Data-Driven Investor to keep reading this post and get 7 days of free access to the full post archives.