


No Good News from Nvidia and Jerome Powell

SPY 0.00%↑ continues to experience weakness at the 30 day VWAP. When working in portfolio management our goal was always to sell positions at or above the VWAP.

Below are SPY options expiring over the next 6 TDs. $500, $525, $540, and $550 are the most important levels. If we can break above $530 we may make a run back towards $540 fairly quickly. It’s a positive that $520 held again today for the second time in a week. If it’s tested a third time, then it’s not likely to hold.

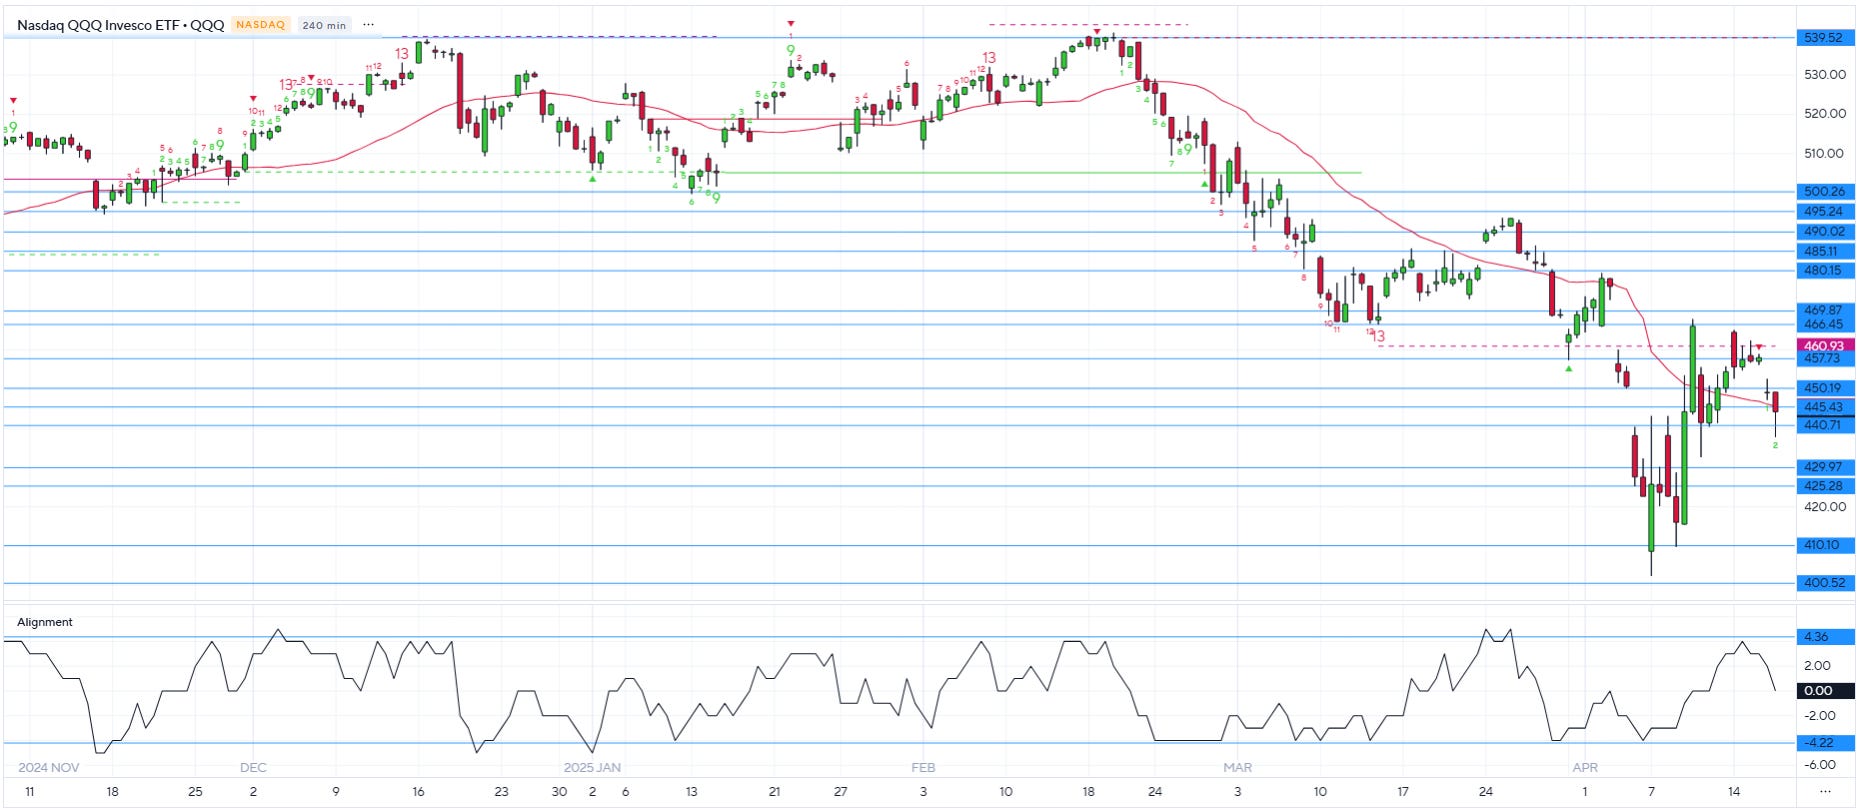
The QQQs reached overbought levels based on the 4-hour chart yesterday and pulled back today on write-off news from NVDA 0.00%↑ and J. Powell reiterating he will not be reducing rates in the face of tariff-driven inflation.
“What You Have to Believe” Sensitivity
The sensitivity I created below sensitizes end of year S&P 500 (SPX) targets and recession probability to estimate a hypothetical fair value for the S&P 500. Using the end of year average base case target from Goldman Sachs and Morgan Stanley combined with recession odds from Polymarket/Kalshi, the current fair value of SPX is 5,230. At the moment, anything in that yellow zone could make sense to me, but the current situation is highly fluid. For me the most challenging target is the “bull case level”. I can’t see the S&P 500 ending the year above 6,000 at this point (average of all investment bank estimates), however many investment banks still have targets well above this level therefore I’ve tried to remain somewhat optimistic. Some banks are already bringing their targets down such as Goldman Sachs (5,700), Oppenheimer (5,950), JP Morgan (5,200), and BofA (5,600). Earlier this year they all had 6,500+ targets while yours truly was less optimistic given many signals that positioning and sentiment were offsides.
Based on today’s estimates in the chart the S&P right where it should be.

PLEASE READ: The chart below is what I use to time long-term buys (e.g. retirement funds). I always maximize my equity allocation when the market enters the dark green zone, but those opportunities only come around a few times a year. Buying equities in the light green zone is a good option as well because it’s better to put money to work sooner rather than later. The red zone is higher risk and can often lead to immediate losses, so I never buy equities when the red signal line is in the red zone (typically reallocating from stocks to bonds here). I also never go short in my long-term portfolio because stocks go up more than 50% of the time and when they do go down, they don’t tend to stay down for very long (i.e. shorting is hard).
S&P 500 15 Trading Day Model and Related Data (Explanations are in the Appendix)


Keep reading with a 7-day free trial
Subscribe to The Data-Driven Investor to keep reading this post and get 7 days of free access to the full post archives.