


OPEX Leaves Bulls Feeling Vulnerable, Will $NVDA Save the Day?

Starting this update off with my most bearish take, then finishing with some hope for bulls next week…
Looking at the recent trend it feels like the same level of chasing that occured after the covid crash in spring 2020. The angle of the trend lines is the same, NAAIM levels are the same, and the Chaiken Money Flow (CMF) looks similar as well. Notice the sharp point (final squeeze) that occurred in 2020, and the lack of one today. Could this point to ES March 5,100 this coming week? Maybe. I would not rule it out. There seem to be a lot of folks on Twitter calling for a decline this week, while longer term bulls far outnumber bears.
Table 1. ~10% Correction Coming?

I looked at CMF levels back to 1995 to see how stock reacted to certain levels. I classified the levels between Melt Down, Buy-the-Dip, Hold, Sell-The-Rip, and Melt-Up. The -0.4% is Friday’s reading and it’s not bullish based on average returns 15 TDs out (after 35 TDs returns flip back to positive). I’d assume given there are 362 observations that the median is positive because stocks go up over time, but the average shows there is risk at this level. Higher risk doesn’t mean stocks go down, but it does mean there is a higher probability that they could go down here (based on history at least).
Table 2. Since 1995, Current CMF Level of 90% is Highest Risk Outside of Melt Downs

The gap between my Relative Value calculation and the price of the S&P 500 is still very wide. I’ve seen it go wider and it probably will, but historically it doesn’t get much wider and I think it starts the mean reversion process sometime after NVDA’s earnings.
Table 3. Mean Reversion Risk Still Very High After This Week as Bonds Pull Back
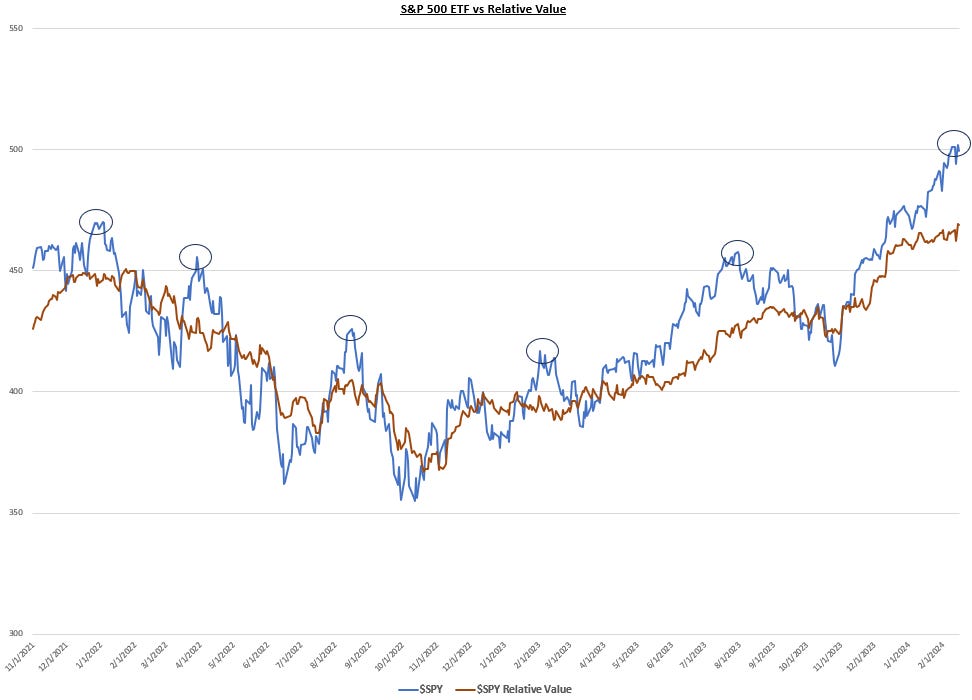
Table 4 shows the signature of whales, a middle finger to retail traders that bought puts expecting a “window of weakness” this week. Assuming this position wasn’t sold Friday (highly doubt it was, probably grew) then I expect one more squeeze higher this week. Prior Februarys have seen the most highs of the month in this week or the first week of February (tie).
Table 4. SPY Feb Put/Call Open Interest as of Thursday’s Close Shows Potential for One More Run to $502

Keep reading with a 7-day free trial
Subscribe to The Data-Driven Investor to keep reading this post and get 7 days of free access to the full post archives.