


Option Flow Signal Update 6/17/2025

Index Models (Based on Option Flows)
Note: Red zone is bearish where investors should sell positions, green zone is bullish where investors should accumulate positions (neutral = coin toss). Signals in the index models drive the bias for single stock positions (i.e., if index models are bearish, going long a single stock within the index isn’t smart regardless of the underlying signal).
S&P 500 SPY 0.00%↑ 5 Trading Day (TD) Risk Model
Previous Signal: Neutral
Current Signal: Slightly Bullish

S&P 500 SPY 0.00%↑ 15 TD Risk Model
Previous Signal: Slightly Bearish
Current Signal: Neutral

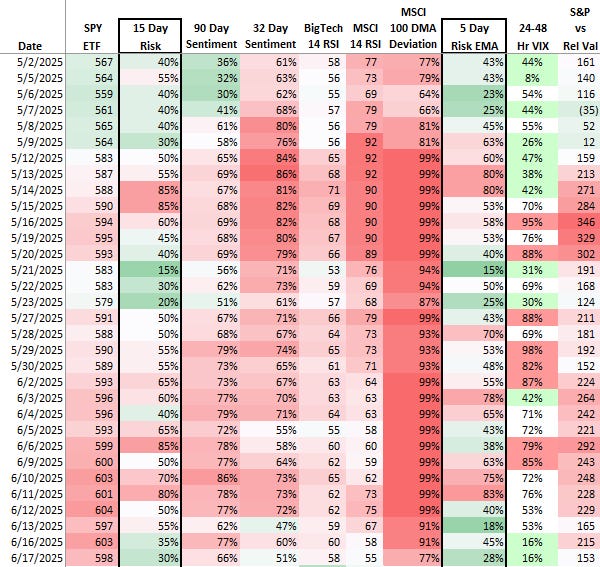
Note: Signal line in the 15 TD chart above is the 3-day moving average (DMA) of 15 Day Risk column. 5 TD chart above is the 5 Day Risk EMA column. Everything else in the table is a “nice to know” metric (details in Appendix). For details on the 15 Day Risk signal models check out this post.
QQQ 0.00%↑ 15 TD Risk Model
Previous Signal: Neutral
Current Signal: Bullish

Russell 2000 IWM 0.00%↑15 TD Risk Model
Previous Signal: Bearish
Current Signal: Neutral
Single Stock Models (Based on Option Flows)
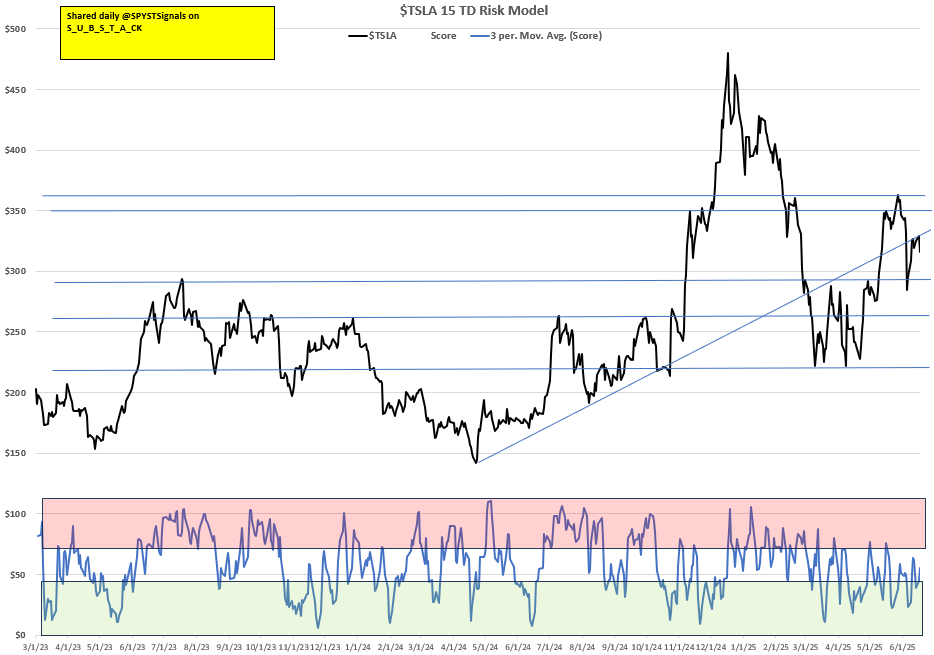
TSLA 0.00%↑ 15 TD Risk Model
Previous Signal: Bullish
Current Signal: Neutral
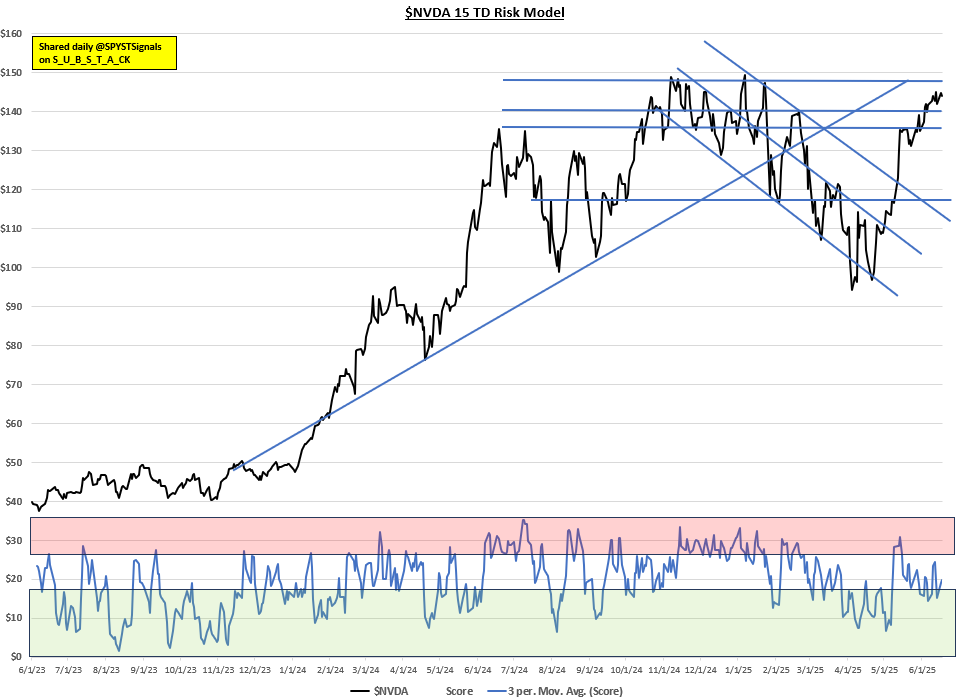
NVDA 0.00%↑ 15 TD Risk Model
Got the expected post-earnings pop in the shares. NVDA broke above resistance, then fell back below it after failing at $140 resistance. There was a ton of open interest at those higher levels and it’s likely those call option holders sold driving price lower.
Previous Signal: Bullish
Current Signal: Neutral
AAPL 0.00%↑ 15 TD Risk Model
Previous Signal: Neutral
Current Signal: Bullish

MSTR 0.00%↑ 15 TD Risk Model
Previous Signal: Neutral
Current Signal: Bearish

$VIX 10 TD Risk Model
Previous Signal: Neutral
Current Signal: Bearish Vol

Note: All the charts above use a 3 DMA of the signals in the table below since the 3 DMA was found to be more accurate than the individual day symbols. JFYI VIX signal data driving VIX chart not added to table below yet. The 1-2 TD Risk under VIX is a super short-term model I don’t use in chart form, but it’s a component of the 5 TD risk model for SPY.


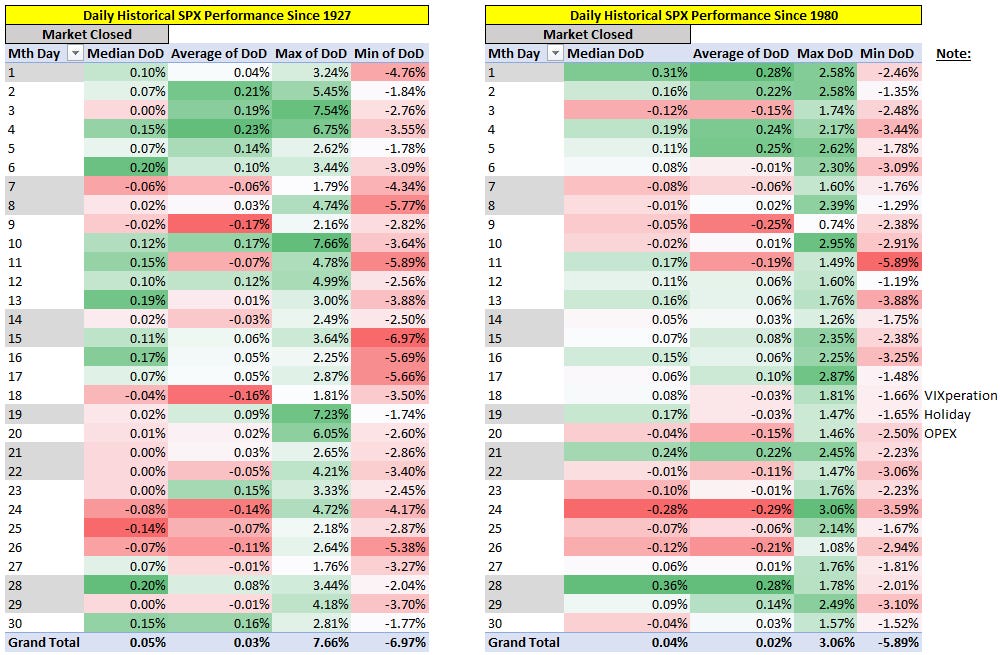
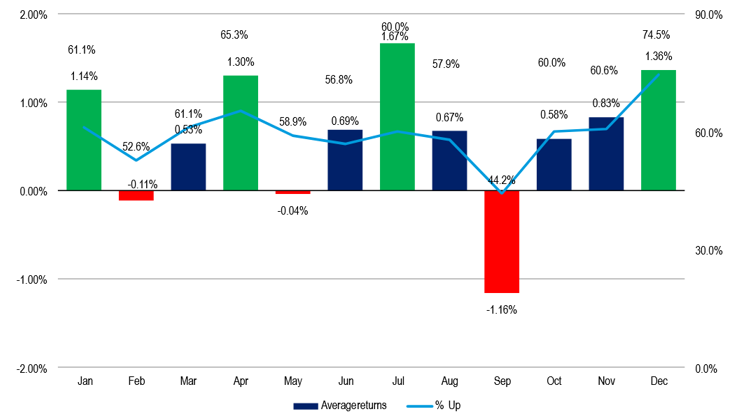
June Seasonality
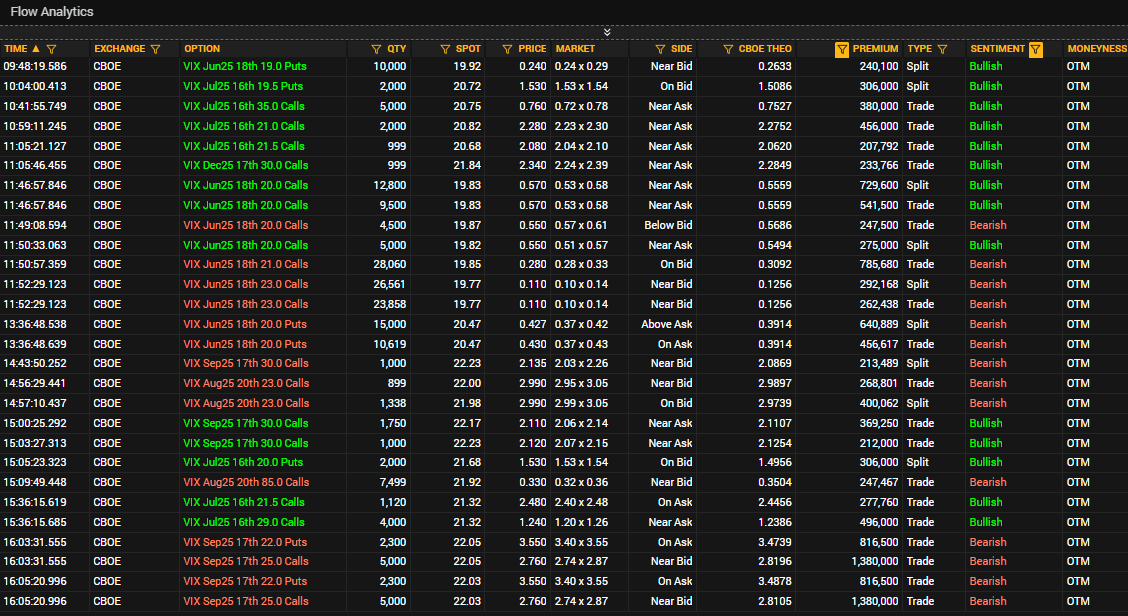
Large OTM Option Orders of the Day:

Summary
Yesterday’s signals we pretty neutral across the board and there was heavy VIX call flow, and today’s those calls printed. Today’s VIX call flow started strong but then flipped leaning bearish vol after lunch. I think we have one more VIX spike coming at any time, which will be when the US inevitably bombs Iran’s nuclear sites. Israel does not have the bombs to do it, Tehran has been alerted to evacuate, and the US has said Iran cannot have a nuclear weapon (i.e., the writing is on the wall). Only way it doesn’t happen is if Iran comes back to the table and that seems highly unlikely. According to a Bloomberg expert, if the US does get involved no one else will step in for Iran so the whole thing (peak risk at least) will be over once the US takes out their nuclear sites. Tricky part is no one knows when it will happen, but it’s likely anytime in the next 2 weeks.
Signals leaned bullish to neutral today (generally). Tomorrow is fed day and J.P. is likely to hold rates flat on Wednesday, which means Trump is likely to blow a gasket and we know what happens when he goes on tantrums related to firing J.P. so longs have two potential tape bombs to deal with. IMHO the easier trade is a quick short of any rip tomorrow operating under the assumption a tape bomb (no pun intended) is just around the corner. My plan is to sell longs and hedge on strength tomorrow. If there is no strength tomorrow then well, that would suck since I do have longs I’ve bought over the past 24 hrs. The goal is to time the sell just right before Trump starts tweeting…Also my operating assumption is that if tomorrow ends green my models will flip to a more bearish stance. There are only a small number of bearish models currently so aside from seasonality and the obvious tape bomb risks I mentioned, I don’t have a reason to be super bearish here. 15 TDs from now I think the market looks past all of these issues unless Trump goes after J.P. more seriously than past rants. If Trump were to pursue removing J.P. expect the bottom to fall out of the dollar, higher interest rates, and stocks to initially sell off.

Disclaimer
This document does not contain financial advice, and it is provided for entertainment purposes only. The risk of investing in certain financial instruments, including those mentioned in this document, is generally high, as their market value is exposed to many different factors. The performance represented throughout this document is historical and past performance is not a reliable indicator of future results. The author cannot be held responsible for your use of the information contained in this document. The author also assumes no responsibility or liability for any errors or omissions in the content of this document. All content within this document is the property of SPYSTSignals, LLC unless otherwise stated (all rights reserved). No part of this document may be reproduced, transmitted or copied in any form or by any means without the prior written consent of SPYSTSignals, LLC.
Appendixes
How My Models Work [This Section is Appended to the Bottom of All Newsletters]
Starting from the left of the table below:
SPY ETF: SPY is the ticker for the largest S&P 500 ETF and the value is the closing price as of the date shown.
15 Day Risk Model: The score from this model is made up of ~25 different models that are built on different market metrics (e.g. breadth, price, relative valuation, sentiment, gamma, etc.). Each model looks at the metric for the date shown, finds a historical match, and serves up the historic median return for the S&P 500 15 trading days later. These values are then ranked across historical values to determine a score from 0-100%. 100% is max bearish and vice versa. If you want to know specifics about what’s in the model, I wrote about it here.
90 Day Sentiment: This is a “nice to know” indicator. It looks at sentiment across select metrics related to the markets (e.g. ISEE, NAAIM, CFTC data, etc.) and simply ranks them over 90 days.
32 Day Sentiment: This is a “nice to know” indicator. It looks at sentiment across select metrics related to the markets (e.g. ISEE, NAAIM, P/C ratios, etc.) and simply ranks them over 32 days. Compared to 90 Day Sentiment, it also uses less delayed metrics (e.g. CFTC data).
Big Tech 14 RSI: This is a “nice to know” indicator. It is the 14-day relative strength index of Apple, Microsoft, Amazon, Google, Tesla, Facebook/Meta, and Nvidia combined.
MSCI 14 RSI: This is a “nice to know” indicator. It is the 14-day relative strength index of the iShares MSCI ACWI ETF which tracks an index composed of large and mid-capitalization developed and emerging market equities. It provides a world-wide view of strength in equities.
MSCI 100 DMA Deviation: This ranks the current deviation of MSCI price from its 100 DMA over the last 70 days.
S&P 500 Relative Value: This is the output of a relative value model I created for the S&P 500. It looks at the value of the S&P relative to other assets (over 100 days), in this case 10-year treasuries, junk bonds, and the US Dollar. For instance, if the market is trading far above the S&P 500 Relative Value then it is possible that stocks have got ahead of themselves given the 10-year is used to discount earnings, a stronger dollar negatively impacts earnings of US global companies, and junk bonds trading down can imply a higher level of economic risk. Red is overvalued; green is undervalued.
Daily Table Output Example

Lastly, I use my VIX model to determine where volatility may be headed. This model looks at how investors are positioned in the VIX in an effort to gauge the likelihood of vol moving higher or lower.