


Stock Indexes Crushed on Negative Headlines

Key Index Levels
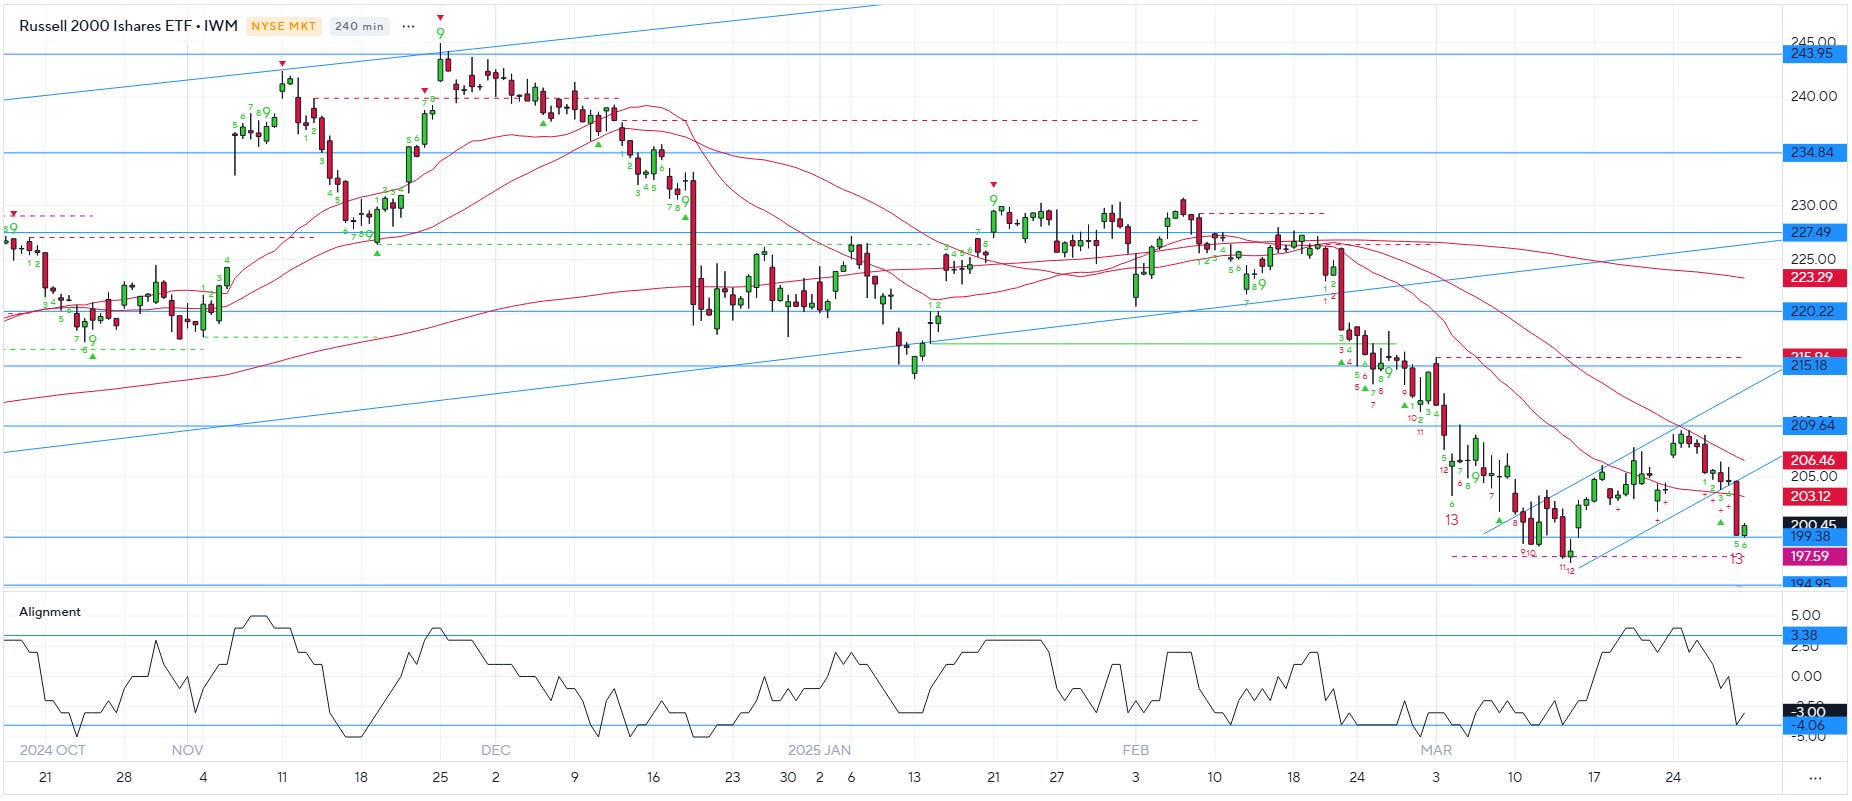
The next 3 charts have support and resistance marked up based on prior levels and gamma through April OPEX. Every index lost bear flag support on Friday after PCE came in hotter than expected, CA talks did not go well, and consumer expectations of inflation were high.

Where could SPY 0.00%↑ go next? If we lose $550 we will likely see $525, which is where Trump’s trade war bottomed previously using positioning as a guide. $525 is also peak negative gamma. I think there is a 50/50 chance we reach that level by May. If we lose $550 that's a potential sign that growth could be deteriorating faster than expected, and recession risk could be increasing. In a recession SPY is likely to reach $460. I think there is a 25% chance of a recession this year (average year odds are 10%). Over time, continued stability in the economic data, especially in the jobs market (weekly claims, monthly payrolls), may provide reassurance that recession risks are overstated. From a policy standpoint, the best-case scenario is Trump reverses many of the tariff plans within the next few weeks, which would result in a sharp rally towards $600 at a minimum.
Generally bearish below $560 and bullish above $570.

The CFTC positioning model I shared previously has finally improved a bit and is now in the neutral zone.

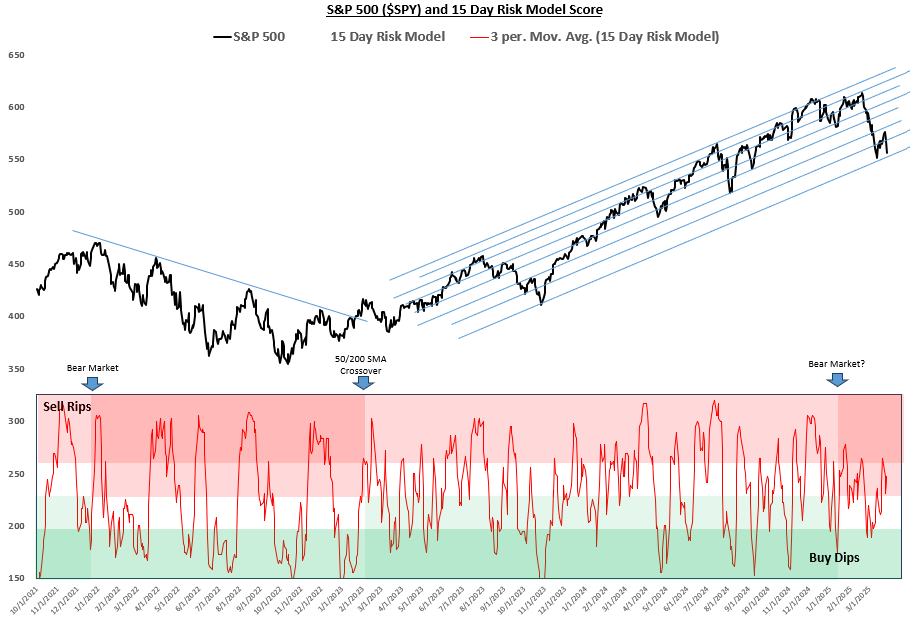
PLEASE READ: The chart below is what I use to time long-term buys (e.g. retirement funds). I always maximize my equity allocation when the market enters the dark green zone, but those opportunities only come around a few times a year. Buying equities in the light green zone is a good option as well because it’s better to put money to work sooner rather than later. The red zone is higher risk and can often lead to immediate losses, so I never buy equities when the red signal line is in the red zone (typically reallocating from stocks to bonds here). I also never go short in my long-term portfolio because stocks go up more than 50% of the time and when they do go down, they don’t tend to stay down for very long (i.e. shorting is hard).
S&P 500 15 Trading Day Model and Related Data (Explanations are in the Appendix)

Keep reading with a 7-day free trial
Subscribe to The Data-Driven Investor to keep reading this post and get 7 days of free access to the full post archives.