
Stock Indexes Hit ATHs (Again)

At the end of every update, I bring everything together summarizing my view on the market using the information here, while also considering research from bulge bracket banks which I read on a regular basis.
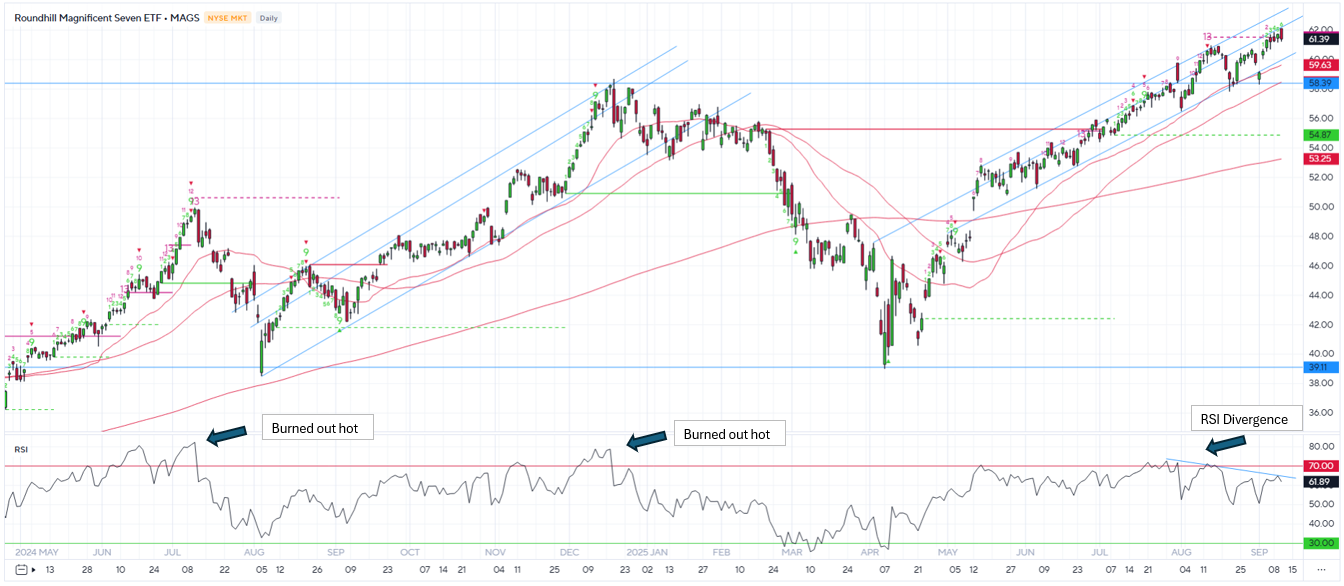
MAGS 0.00%↑ is still operating in an uptrend and hit a new ATH today before coming back to earth. ORCL 0.00%↑ surged along with NVDA 0.00%↑ and AVGO 0.00%↑ today as Oracle incorporated OpenAI’s long term forecast into their own backlog reporting. The OpenAI/Oracle contract begins in 2027 and will last 5 years. OpenAI and Oracle forecast this contract will be worth $300B, which resulted in an epic rally of Oracle’s shares. I happen to work in the space, and I can tell you that no one has any idea what things will look like 2027-2031. We all think AI will be big; forecasts are nothing more than extrapolations and assumptions using very limited information at the moment. 2025 is probably the last “win at any cost” year because at some point this stuff has to make money. The idea that this $300B contract is sure thing and will be incredibly profitable is a HUGE stretch.
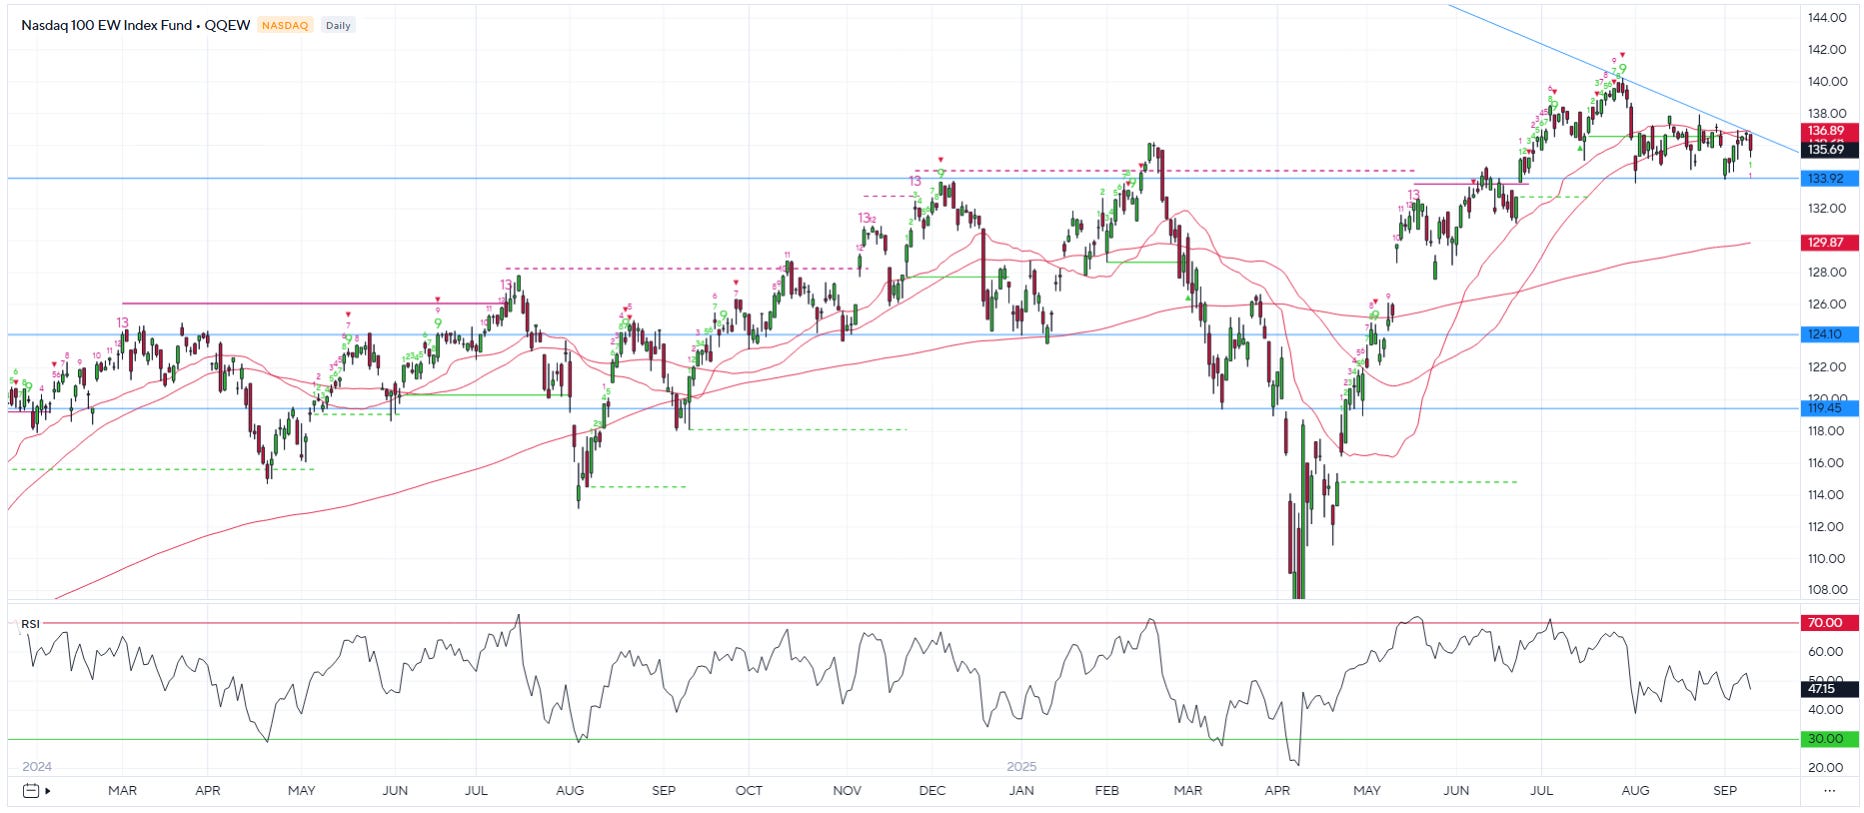
Meanwhile the QQQ equal weight index is also signaling caution as it forms a descending triangle pattern rather than making new highs. While generally considered a bearish continuation pattern, the actual performance varies significantly depending on the market and the breakout direction. Conservative figures suggest a 35–40% probability for a bullish breakout, reflecting the pattern's inherent bearish bias.
Index Models (Based on Option Flows)
Note: Red zone is bearish where investors should sell positions, green zone is bullish where investors should accumulate positions (neutral = coin toss). Signals in the index models drive the bias for single stock positions (i.e., if index models are bearish, going long a single stock within the index isn’t smart regardless of the underlying signal).
Worth noting how my models define bearish and bullish. Bullish is better than historically average returns for the underlying and bearish is below average returns. Key point: bearish does not necessarily mean negative returns are expected, but if they do occur, they are most likely to occur when the model is bearish. “Bearish” is essentially the time to be raising cash, while “Bullish” is the time to buy dips.
S&P 500 SPY 0.00%↑ 5 Trading Day (TD) Risk Model
Keep reading with a 7-day free trial
Subscribe to The Data-Driven Investor to keep reading this post and get 7 days of free access to the full post archives.