


Tech Rallys on Netflix Earnings

Examining the charts for RSP 0.00%↑ to understand what might be around the corner for the S&P 500 is super useful. The equal-weight S&P 500 index reached oversold recently. Looking at the Alignment Score at the bottom of the chart is my favorite indicator.
Daily RSP reached overbought yesterday at resistance and pulled back today. Since December we’ve had the weakest breadth in 40 years, and the strongest breadth in 97 years. Pretty wild.

Strong breadth peaked right where it normally does.

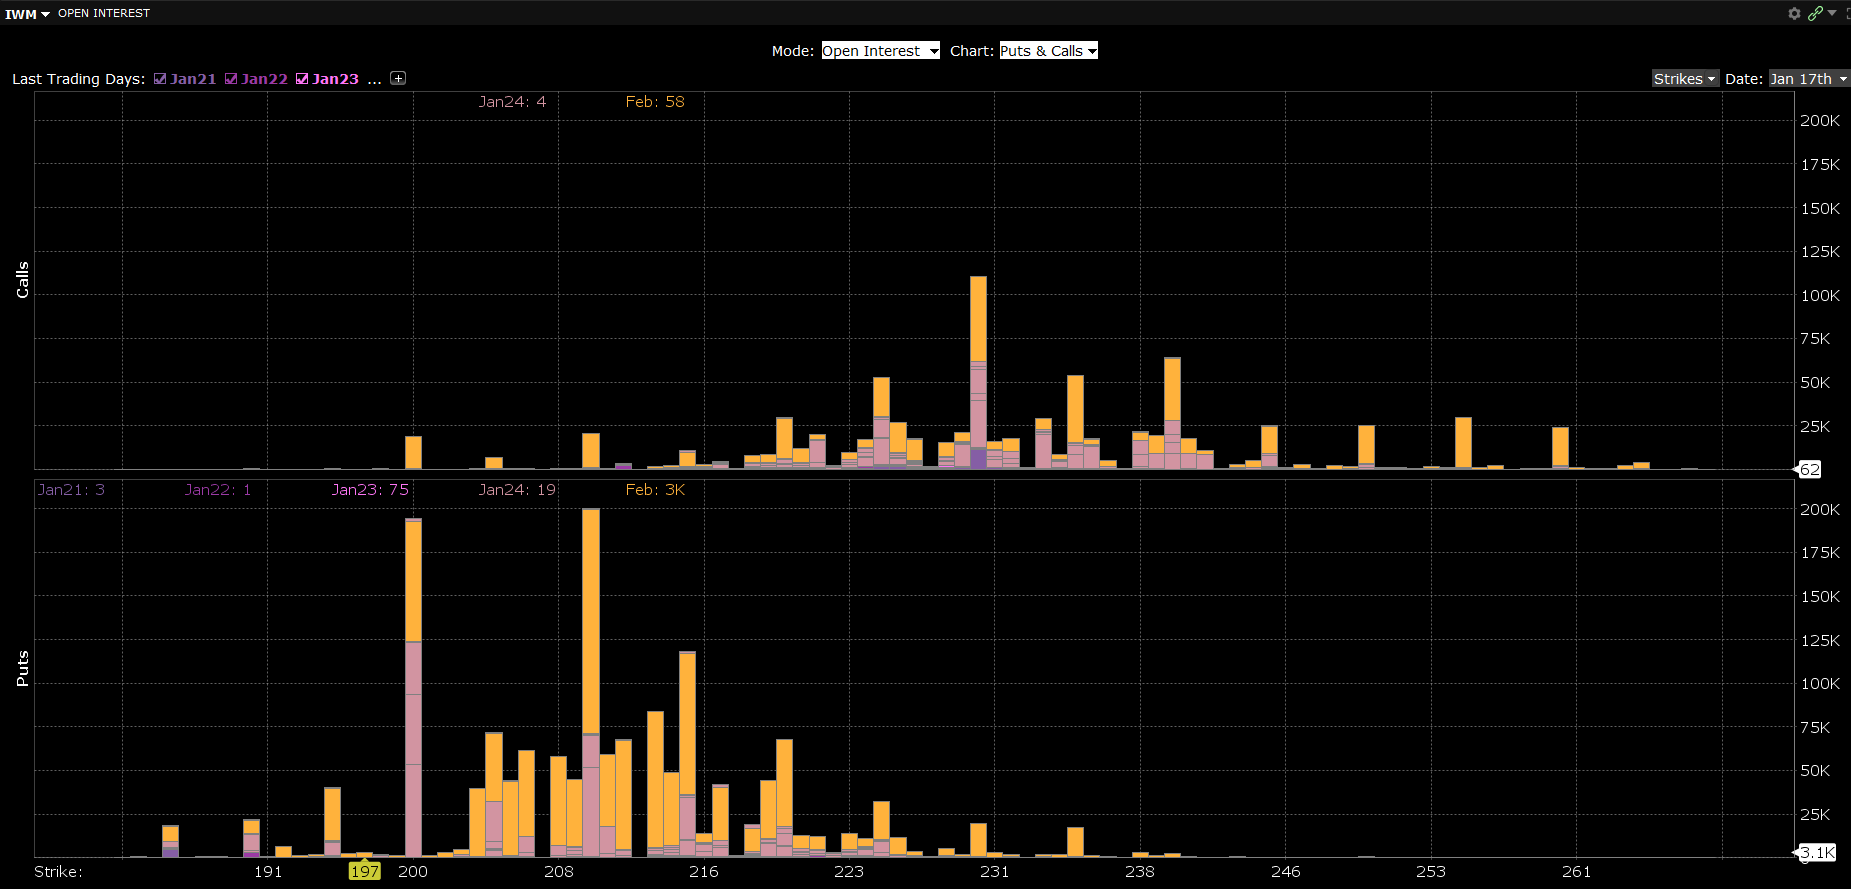
Here is how options open interest (OI) is looking through Feb OPEX for IWM, SPY, VIX, and QQQ. IWM range looks like $210-230. So far, so good.
VIX range is looking like 15-30 (there is always lotto OI out there on VIX…).

QQQ range looks like $500-530. Notice the bright green bar at $530, that big chunk expired today. Market exceeded my high-end guess today possibly because a large chunk was expiring today and it’s possible the firm with those calls used 0DTE to juice gains further (really have no idea). Most of the time large OI levels work, sometimes they don’t.

Keep reading with a 7-day free trial
Subscribe to The Data-Driven Investor to keep reading this post and get 7 days of free access to the full post archives.