


What the Models are Saying Ahead of CPI

At the end of every update, I bring everything together summarizing my view on the market using the information here, while also considering research from bulge bracket banks which I read on a regular basis.
Before I left for vacation last weekend, I said dips would be bought ahead of OPEX as SPY 0.00%↑ targets $630 (don’t fight an uptrend into July OPEX). Still on course for this strategy, and index action continues to be quite boring, though there has been a lot of movement under the surface. VIXperation is this Wednesday, OPEX is Friday, CPI is Tuesday, and Wednesday we have PPI. I consider all inflation reports a risk going forward as inflation should get progressively hotter into September, but the PCE report on 7/31 carries the most risk since it is the Fed’s preferred measure of inflation. I think any CPI and PPI dips this week are likely to be bought, but by the time we reach August and September the market will likely begin to have an allergic reaction to hotter inflation.
Index Models (Based on Option Flows)
Note: Red zone is bearish where investors should sell positions, green zone is bullish where investors should accumulate positions (neutral = coin toss). Signals in the index models drive the bias for single stock positions (i.e., if index models are bearish, going long a single stock within the index isn’t smart regardless of the underlying signal).
Worth noting how my models define bearish and bullish. Bullish is better than historically average returns for the underlying and bearish is below average returns. Key point: bearish does not necessarily mean negative returns are expected, but if they do occur, they are most likely to occur when the model is bearish.
S&P 500 SPY 0.00%↑ 5 Trading Day (TD) Risk Model
Current Signal: Neutral

S&P 500 SPY 0.00%↑ 15 TD Risk Model
Current Signal: Neutral

Note: Signal line in the 15 TD chart above is the 3-day moving average (DMA) of 15 Day Risk column. 5 TD chart above is the 5 Day Risk EMA column. Everything else in the table is a “nice to know” metric (details in Appendix). For details on the 15 Day Risk signal models check out this post.

QQQ 0.00%↑ 15 TD Risk Model
Current Signal: Neutral

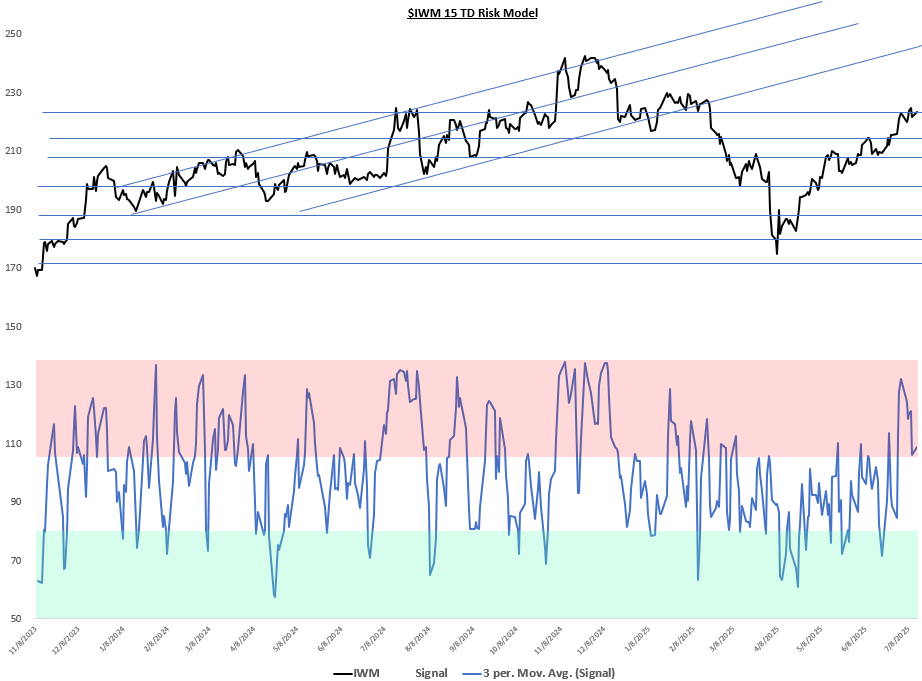
Russell 2000 IWM 0.00%↑15 TD Risk Model
Current Signal: Bearish
Single Stock Models (Based on Option Flows)
TSLA 0.00%↑ 15 TD Risk Model
Current Signal: Neutral

Keep reading with a 7-day free trial
Subscribe to The Data-Driven Investor to keep reading this post and get 7 days of free access to the full post archives.